


Sneak Preview
These videos show how support and resistance is predicted with Fibonacci
See yesterday's FOREX signal preview
NZD/USD how Fibonacci studies predict support/resistance.
NZD/USD trade summary.
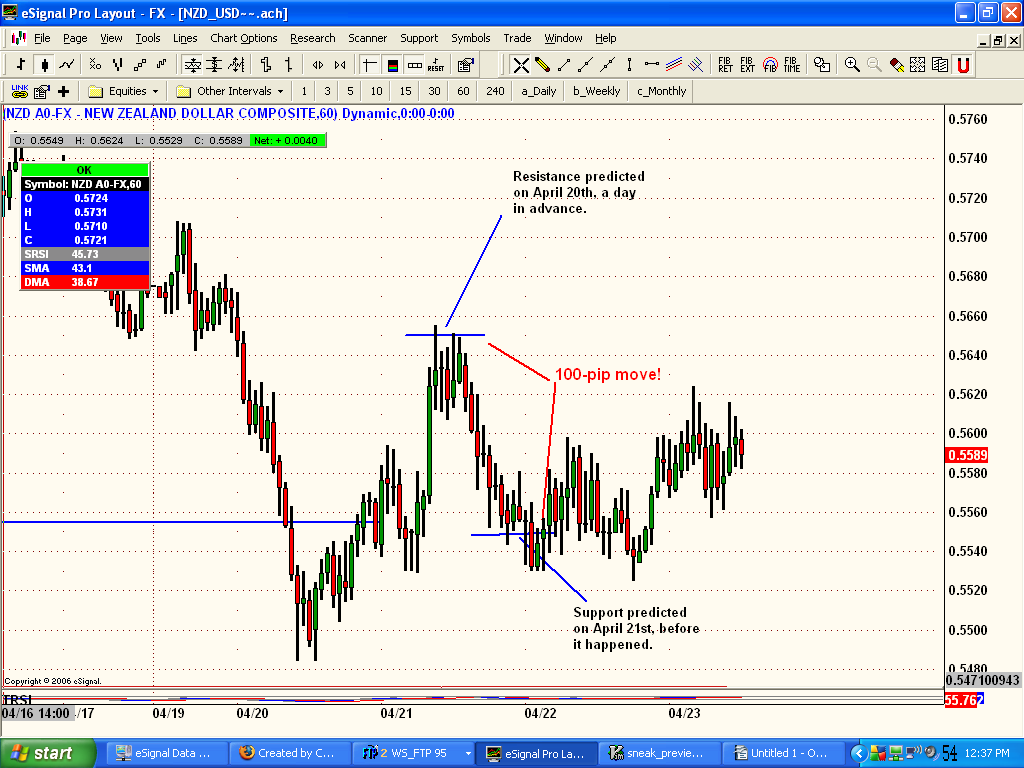
Fibonacci trade chart. In the next two videos you will see how Fibonacci levels are used to predict future support/resistance levels, for a 100-pip move. You can get these great trade setups in your email every day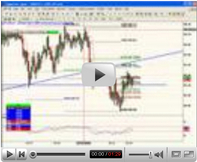
First video:
This chart is ripe for shorting. Watch how I use FibLevels to predict future resistance levels for shorting. Notice the .5650 level on the chart, one of the levels I said we would want to short.. See NZD/USD trade setup.
Second video, next day:
Kiwi is is pumping pips into your bank account! NZD/USD rallies to .5658 and reverses for great trades! It makes a trading pattern of lower swings, we keep shorting with that pattern. Notice I said we may see support at .5550 area. See NZD/USD trade chart video.Do you want FOREX calls like this?
DailyForexCharts is your trading roadmap to improve and maximize your FOREX trading opportunities. Get these charts in your email every day!
Know whether to trade long, short, or to stay out!
Do you want to learn how to trade like this? Download these video seminars, learn the easy way;